3.1 KiB
Monitoring
This guide walks you through configuring monitoring for the Flux control plane.
Flux comes with a monitoring stack composed of:
- Prometheus server - collects metrics from the toolkit controllers and stores them for 2h
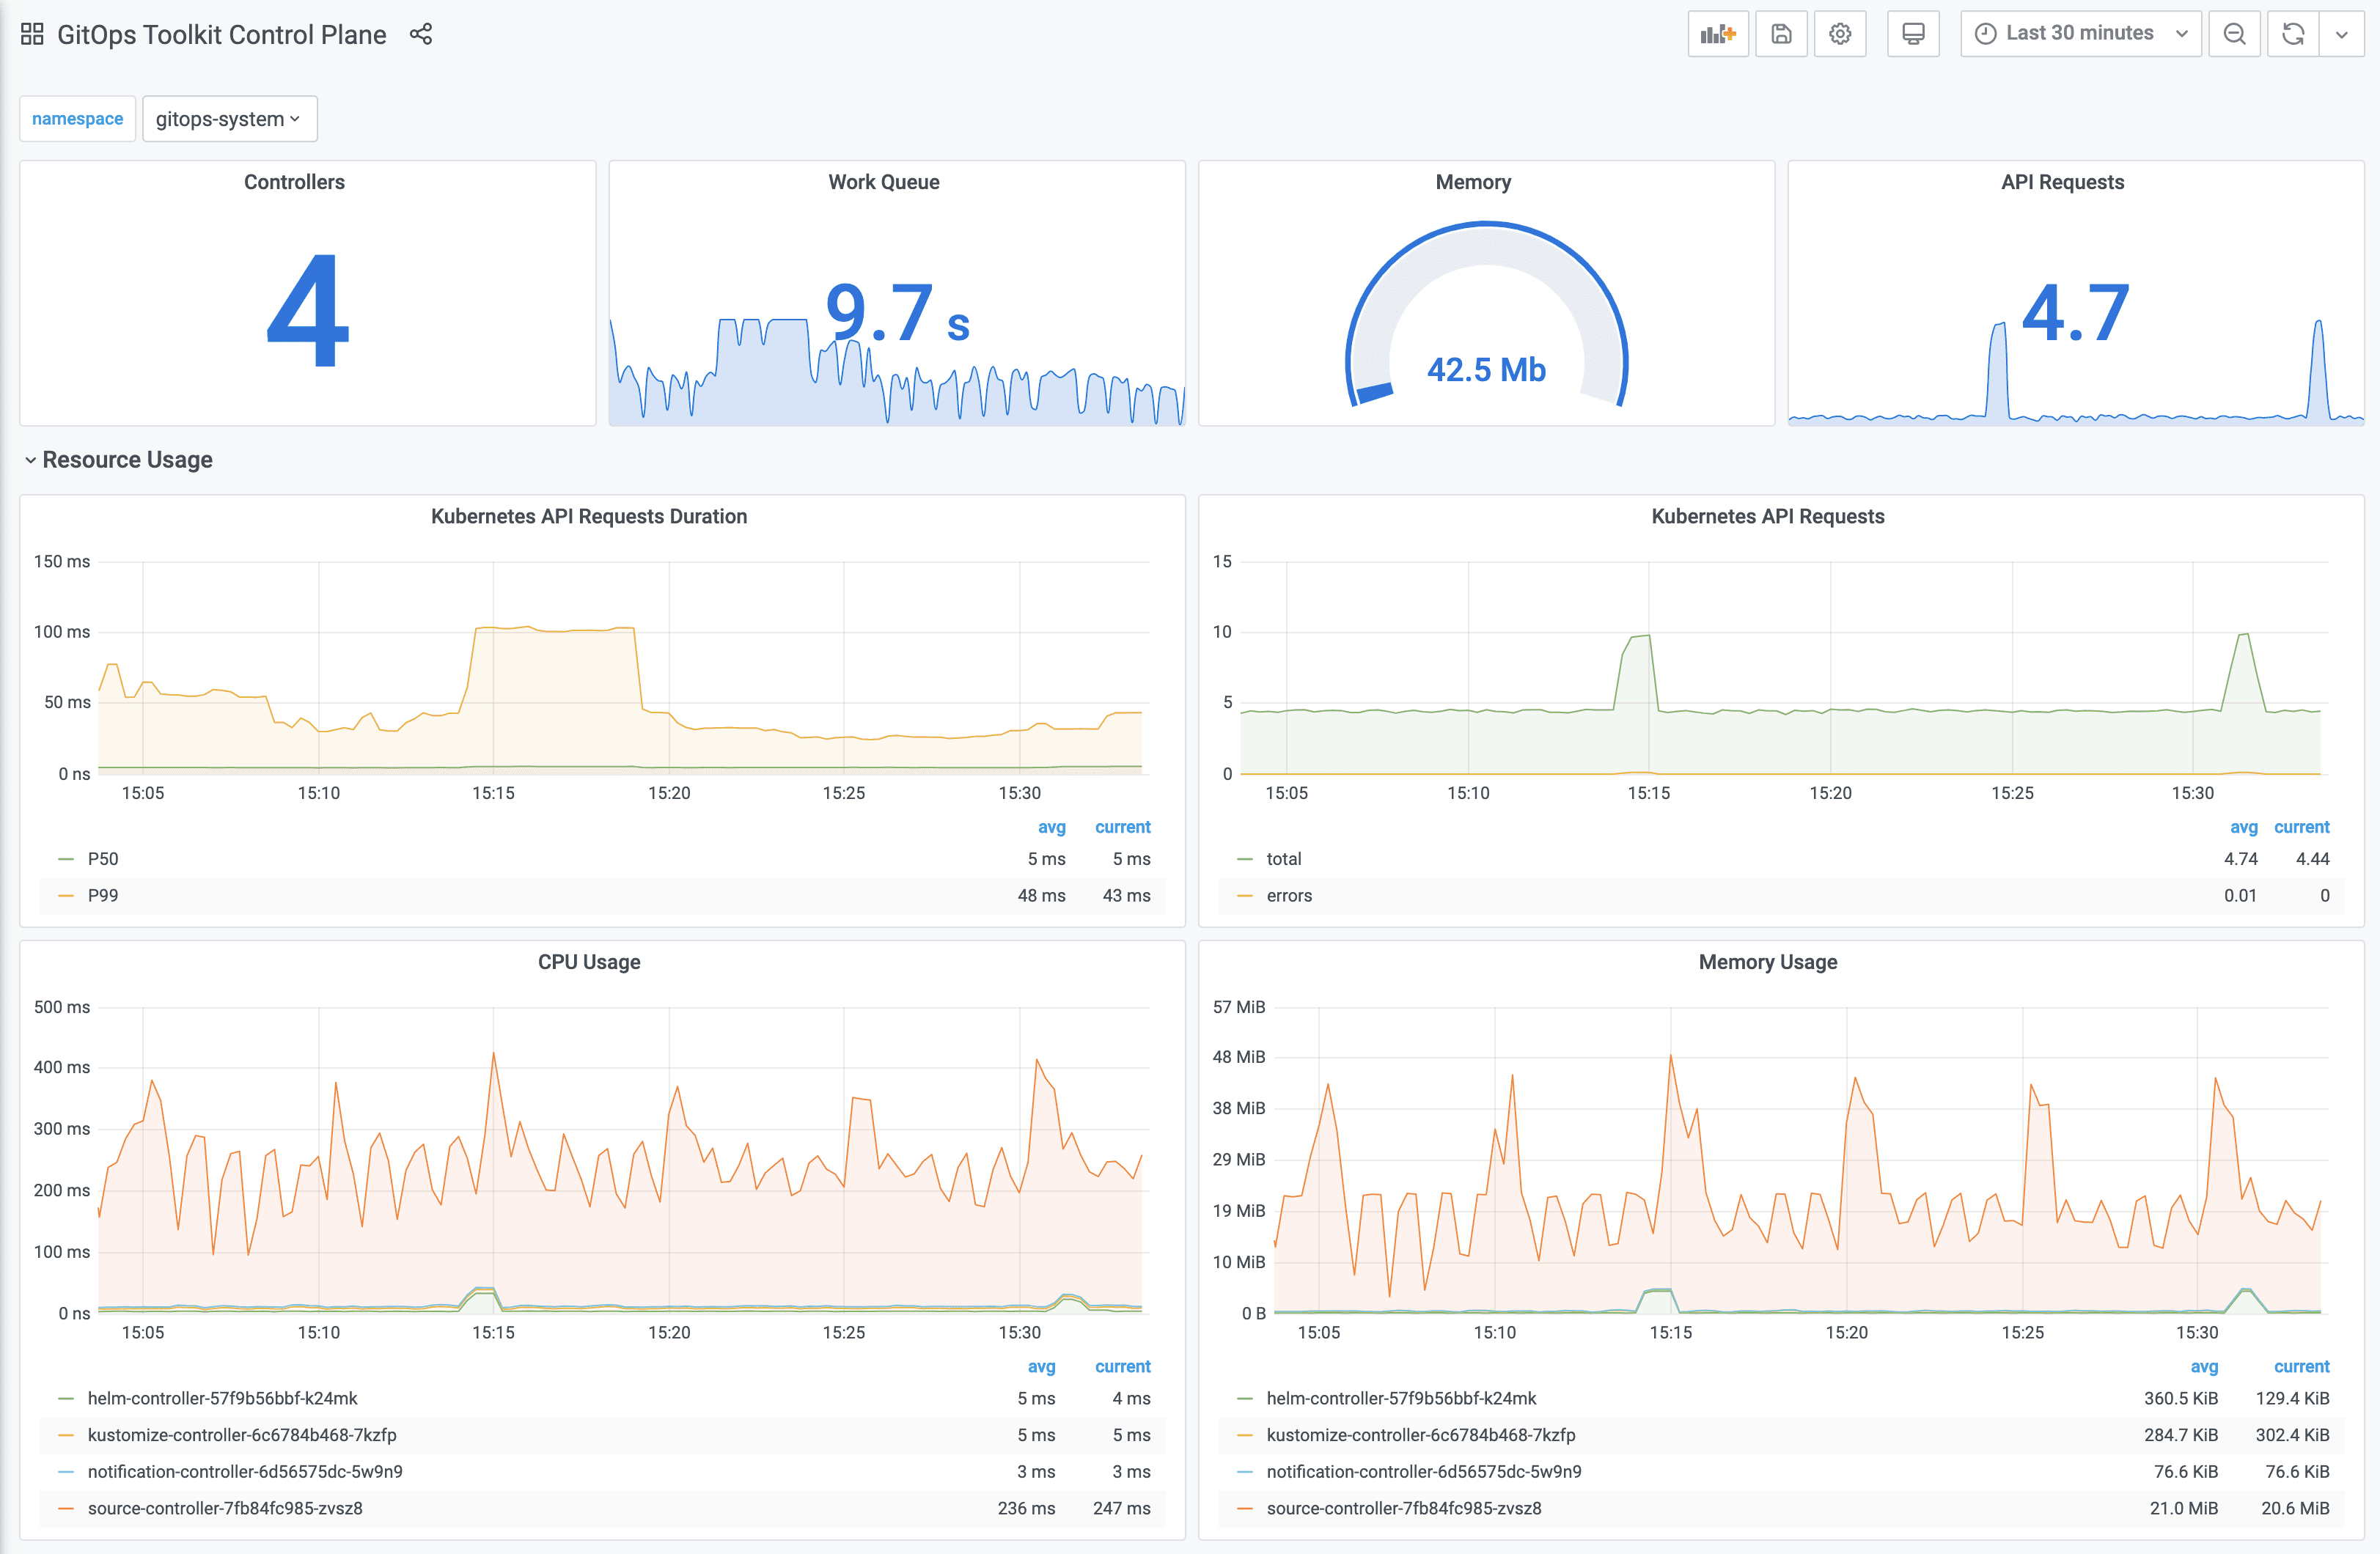
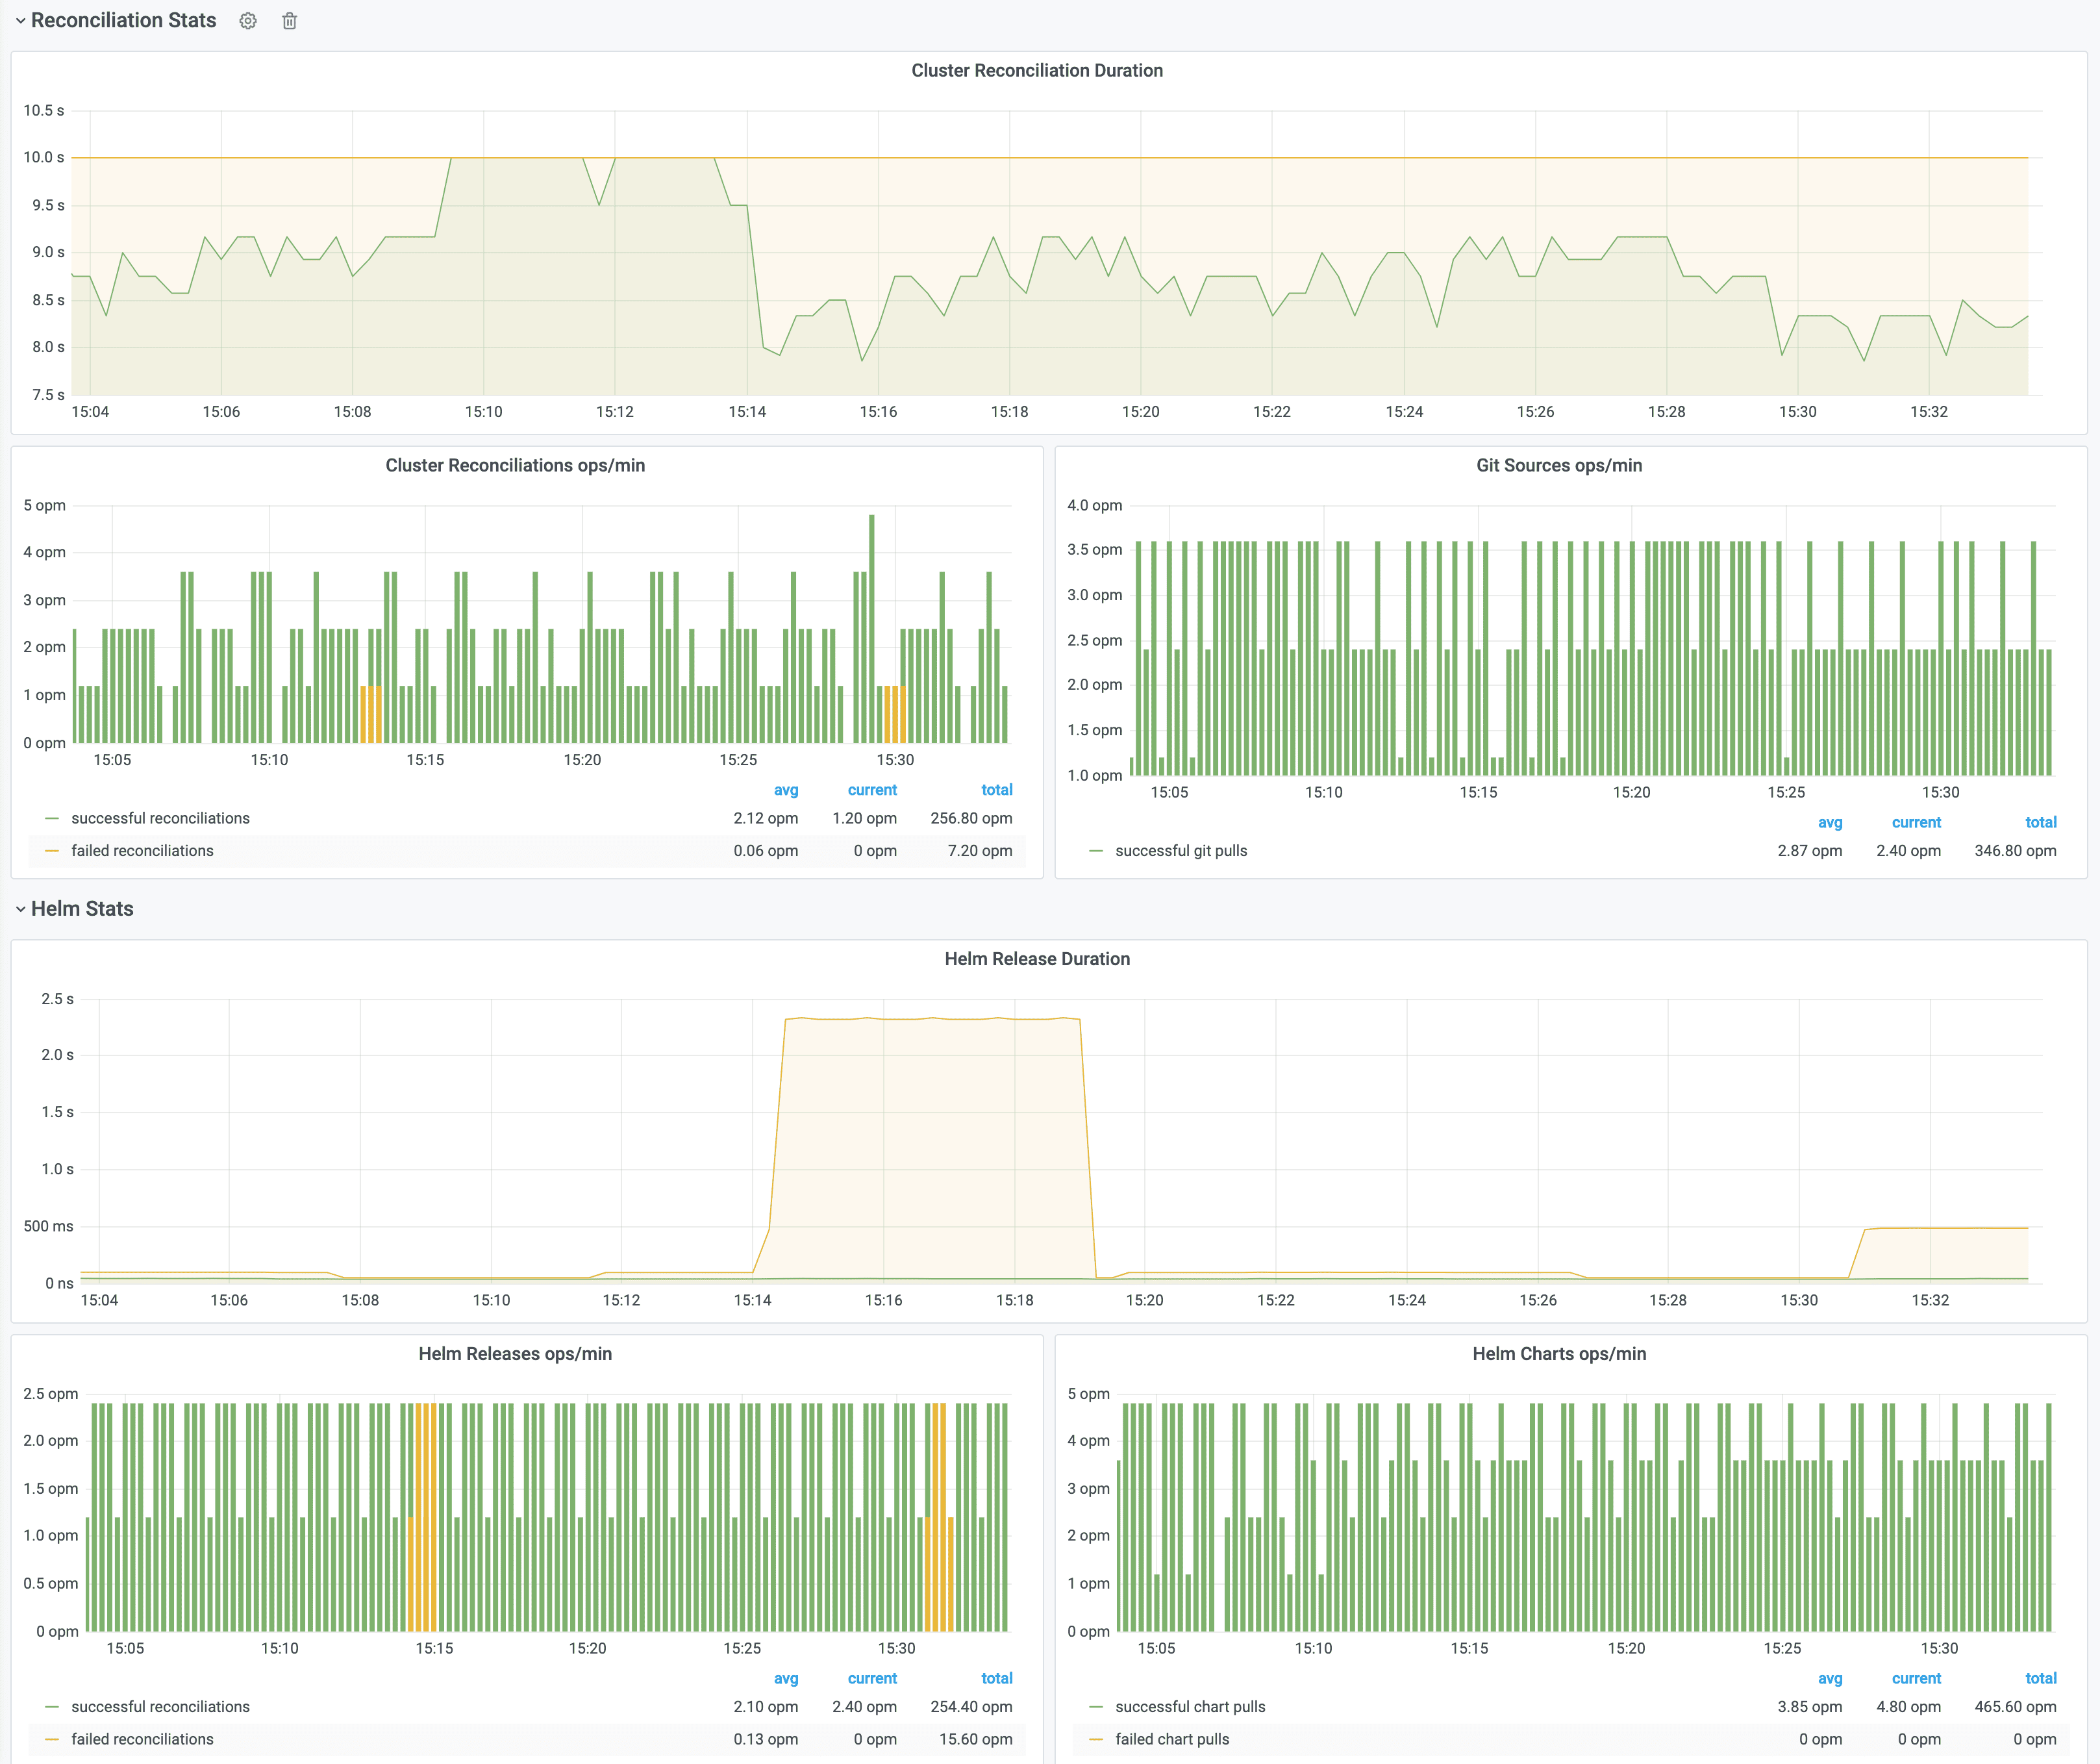
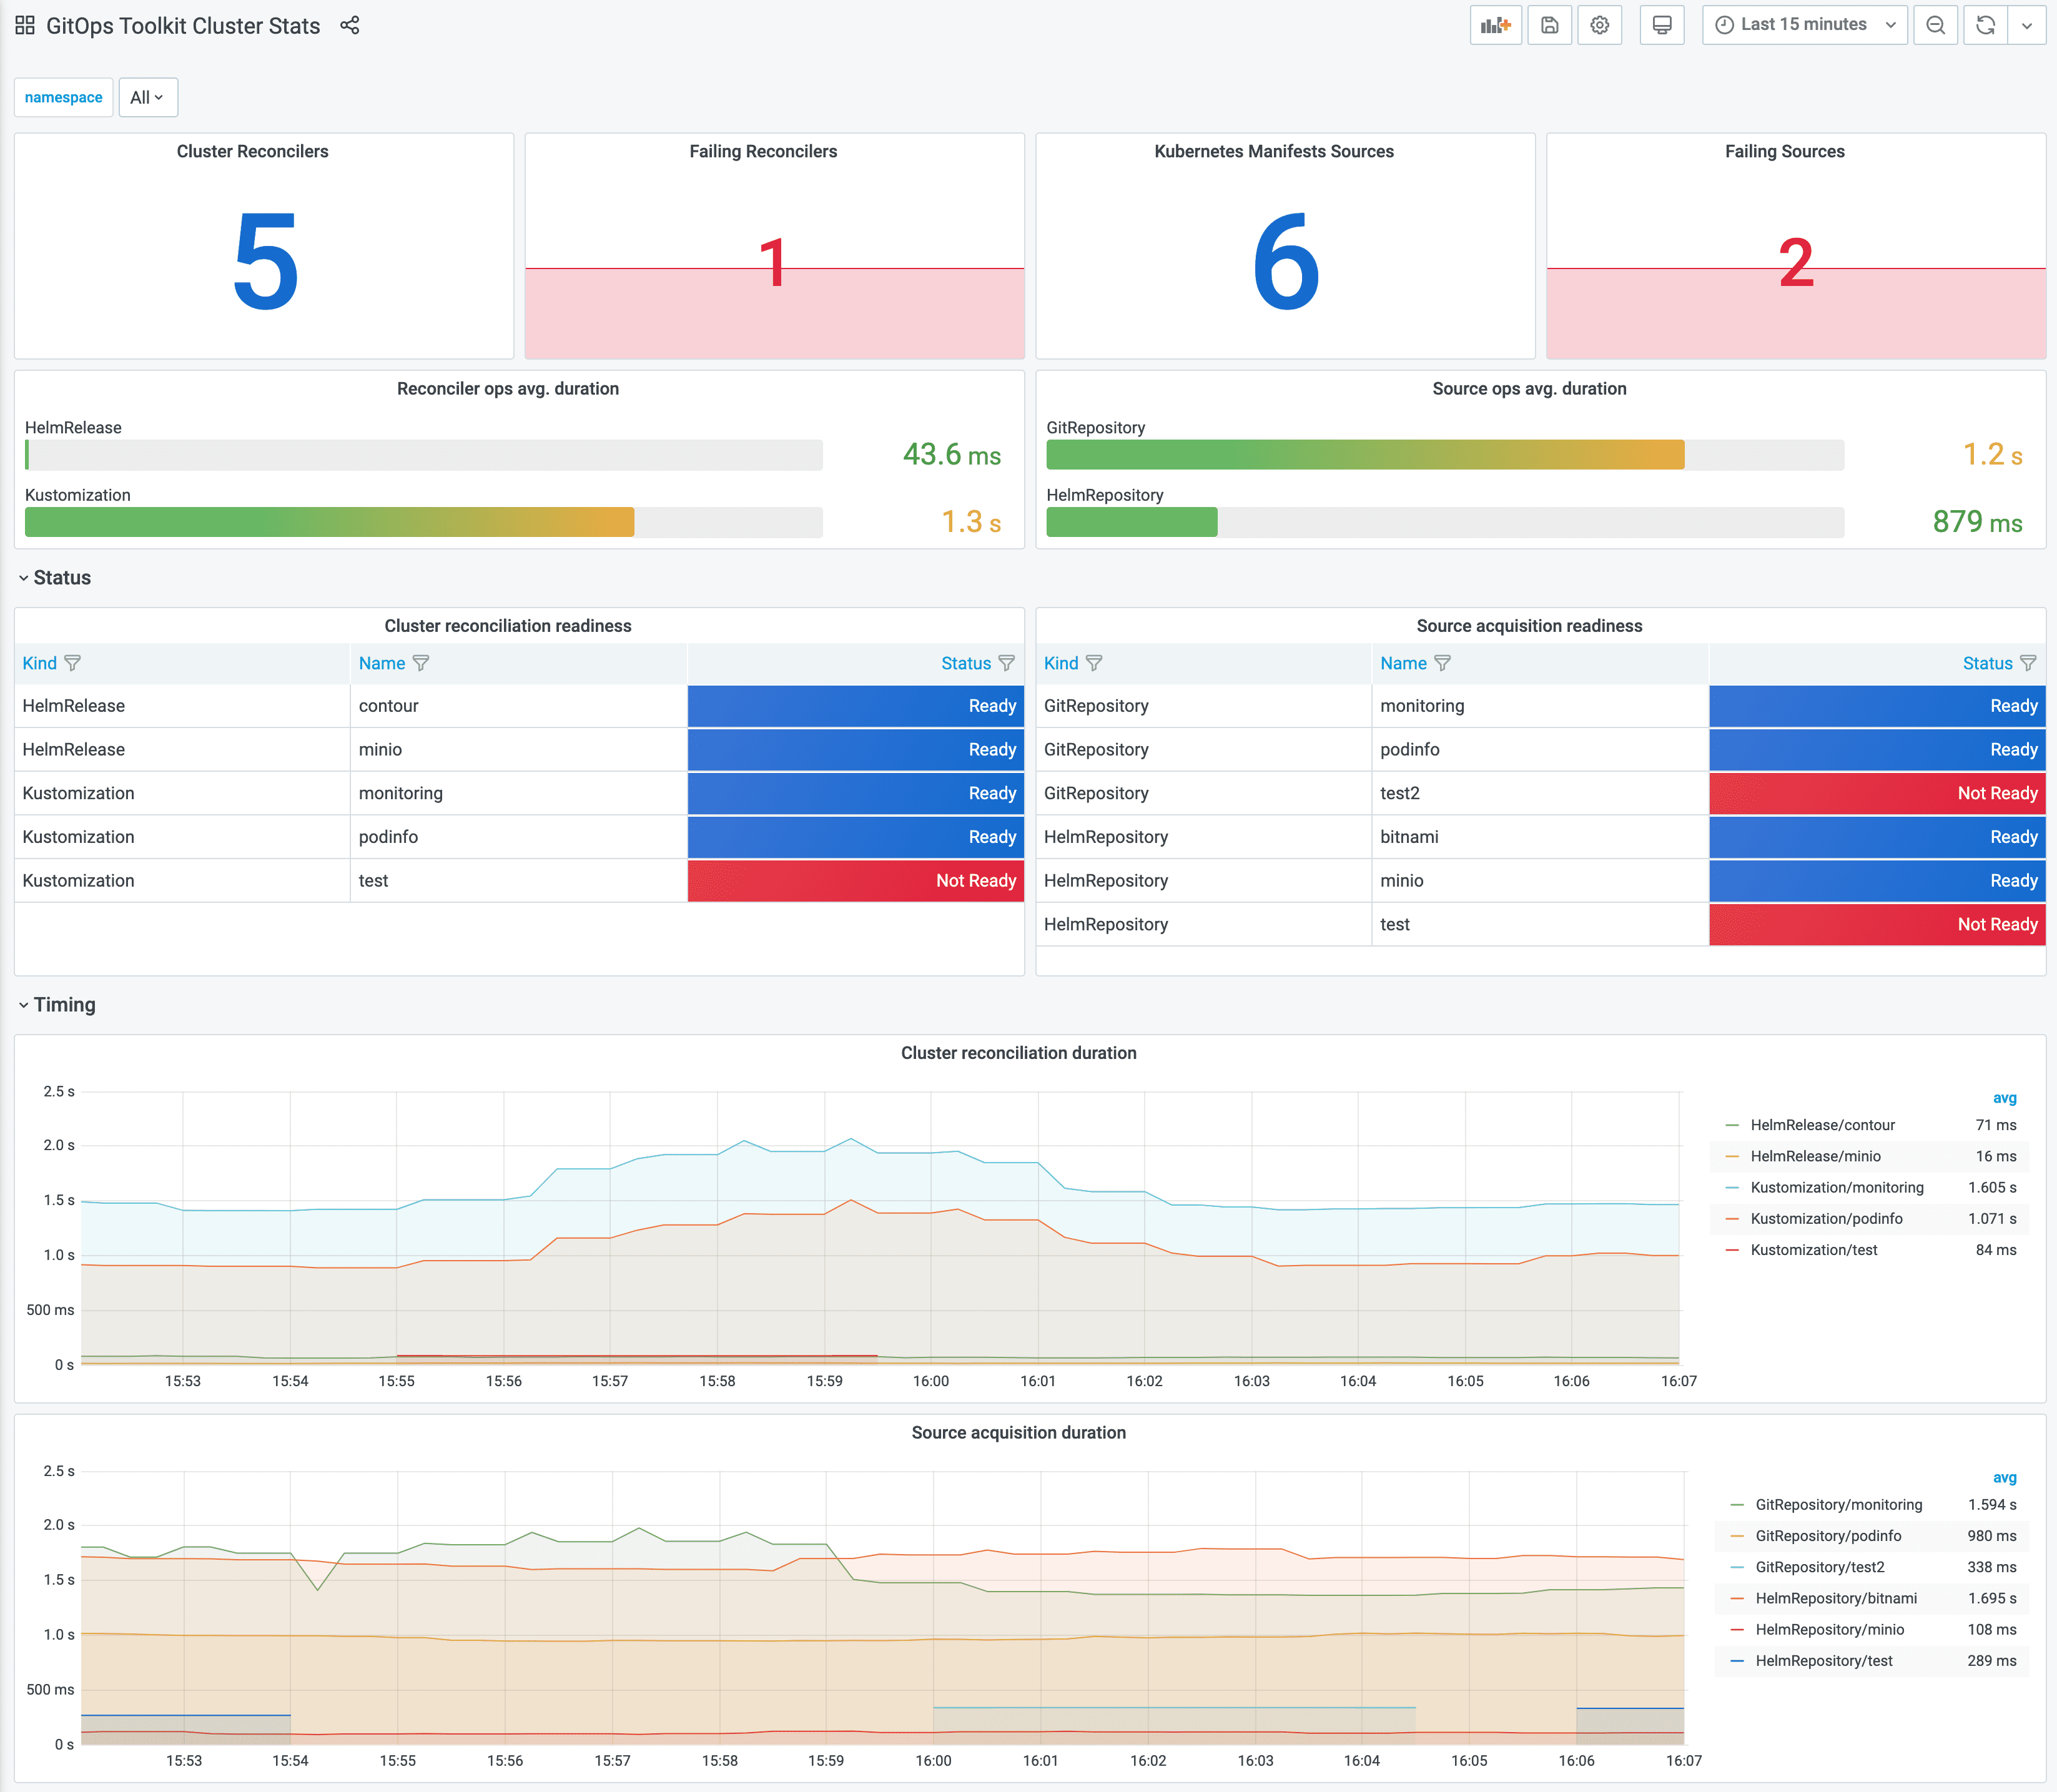
- Grafana dashboards - displays the control plane resource usage and reconciliation stats
Install the monitoring stack
To install the monitoring stack with flux, first register the toolkit Git repository on your cluster:
flux create source git monitoring \
  --interval=30m \
  --url=https://github.com/fluxcd/flux2 \
  --branch=main
Then apply the manifests/monitoring kustomization:
flux create kustomization monitoring \
  --interval=1h \
  --prune=true \
  --source=monitoring \
  --path="./manifests/monitoring" \
  --health-check="Deployment/prometheus.flux-system" \
  --health-check="Deployment/grafana.flux-system"
You can access Grafana using port forwarding:
kubectl -n flux-system port-forward svc/grafana 3000:3000
Grafana dashboards
Control plane dashboard http://localhost:3000/d/gitops-toolkit-control-plane:
Cluster reconciliation dashboard http://localhost:3000/d/gitops-toolkit-cluster:
If you wish to use your own Prometheus and Grafana instances, then you can import the dashboards from GitHub.
!!! hint
Note that the toolkit controllers expose the /metrics endpoint on port 8080.
When using Prometheus Operator you should create PodMonitor objects to configure scraping.
Metrics
For each toolkit.fluxcd.io kind,
the controllers expose a gauge metric to track the Ready condition status,
and a histogram with the reconciliation duration in seconds.
Ready status metrics:
gotk_reconcile_condition{kind, name, namespace, type="Ready", status="True"}
gotk_reconcile_condition{kind, name, namespace, type="Ready", status="False"}
gotk_reconcile_condition{kind, name, namespace, type="Ready", status="Unkown"}
gotk_reconcile_condition{kind, name, namespace, type="Ready", status="Deleted"}
Time spent reconciling:
gotk_reconcile_duration_seconds_bucket{kind, name, namespace, le}
gotk_reconcile_duration_seconds_sum{kind, name, namespace}
gotk_reconcile_duration_seconds_count{kind, name, namespace}
Alert manager example:
groups:
- name: GitOpsToolkit
  rules:
  - alert: ReconciliationFailure
    expr: max(gotk_reconcile_condition{status="False",type="Ready"}) by (namespace, name, kind) + on(namespace, name, kind) (max(gotk_reconcile_condition{status="Deleted"}) by (namespace, name, kind)) * 2 == 1
    for: 10m
    labels:
      severity: page
    annotations:
      summary: '{{ $labels.kind }} {{ $labels.namespace }}/{{ $labels.name }} reconciliation has been failing for more than ten minutes.'


